Note: This feature is only available on Clinical Operations CTMS Vaults.
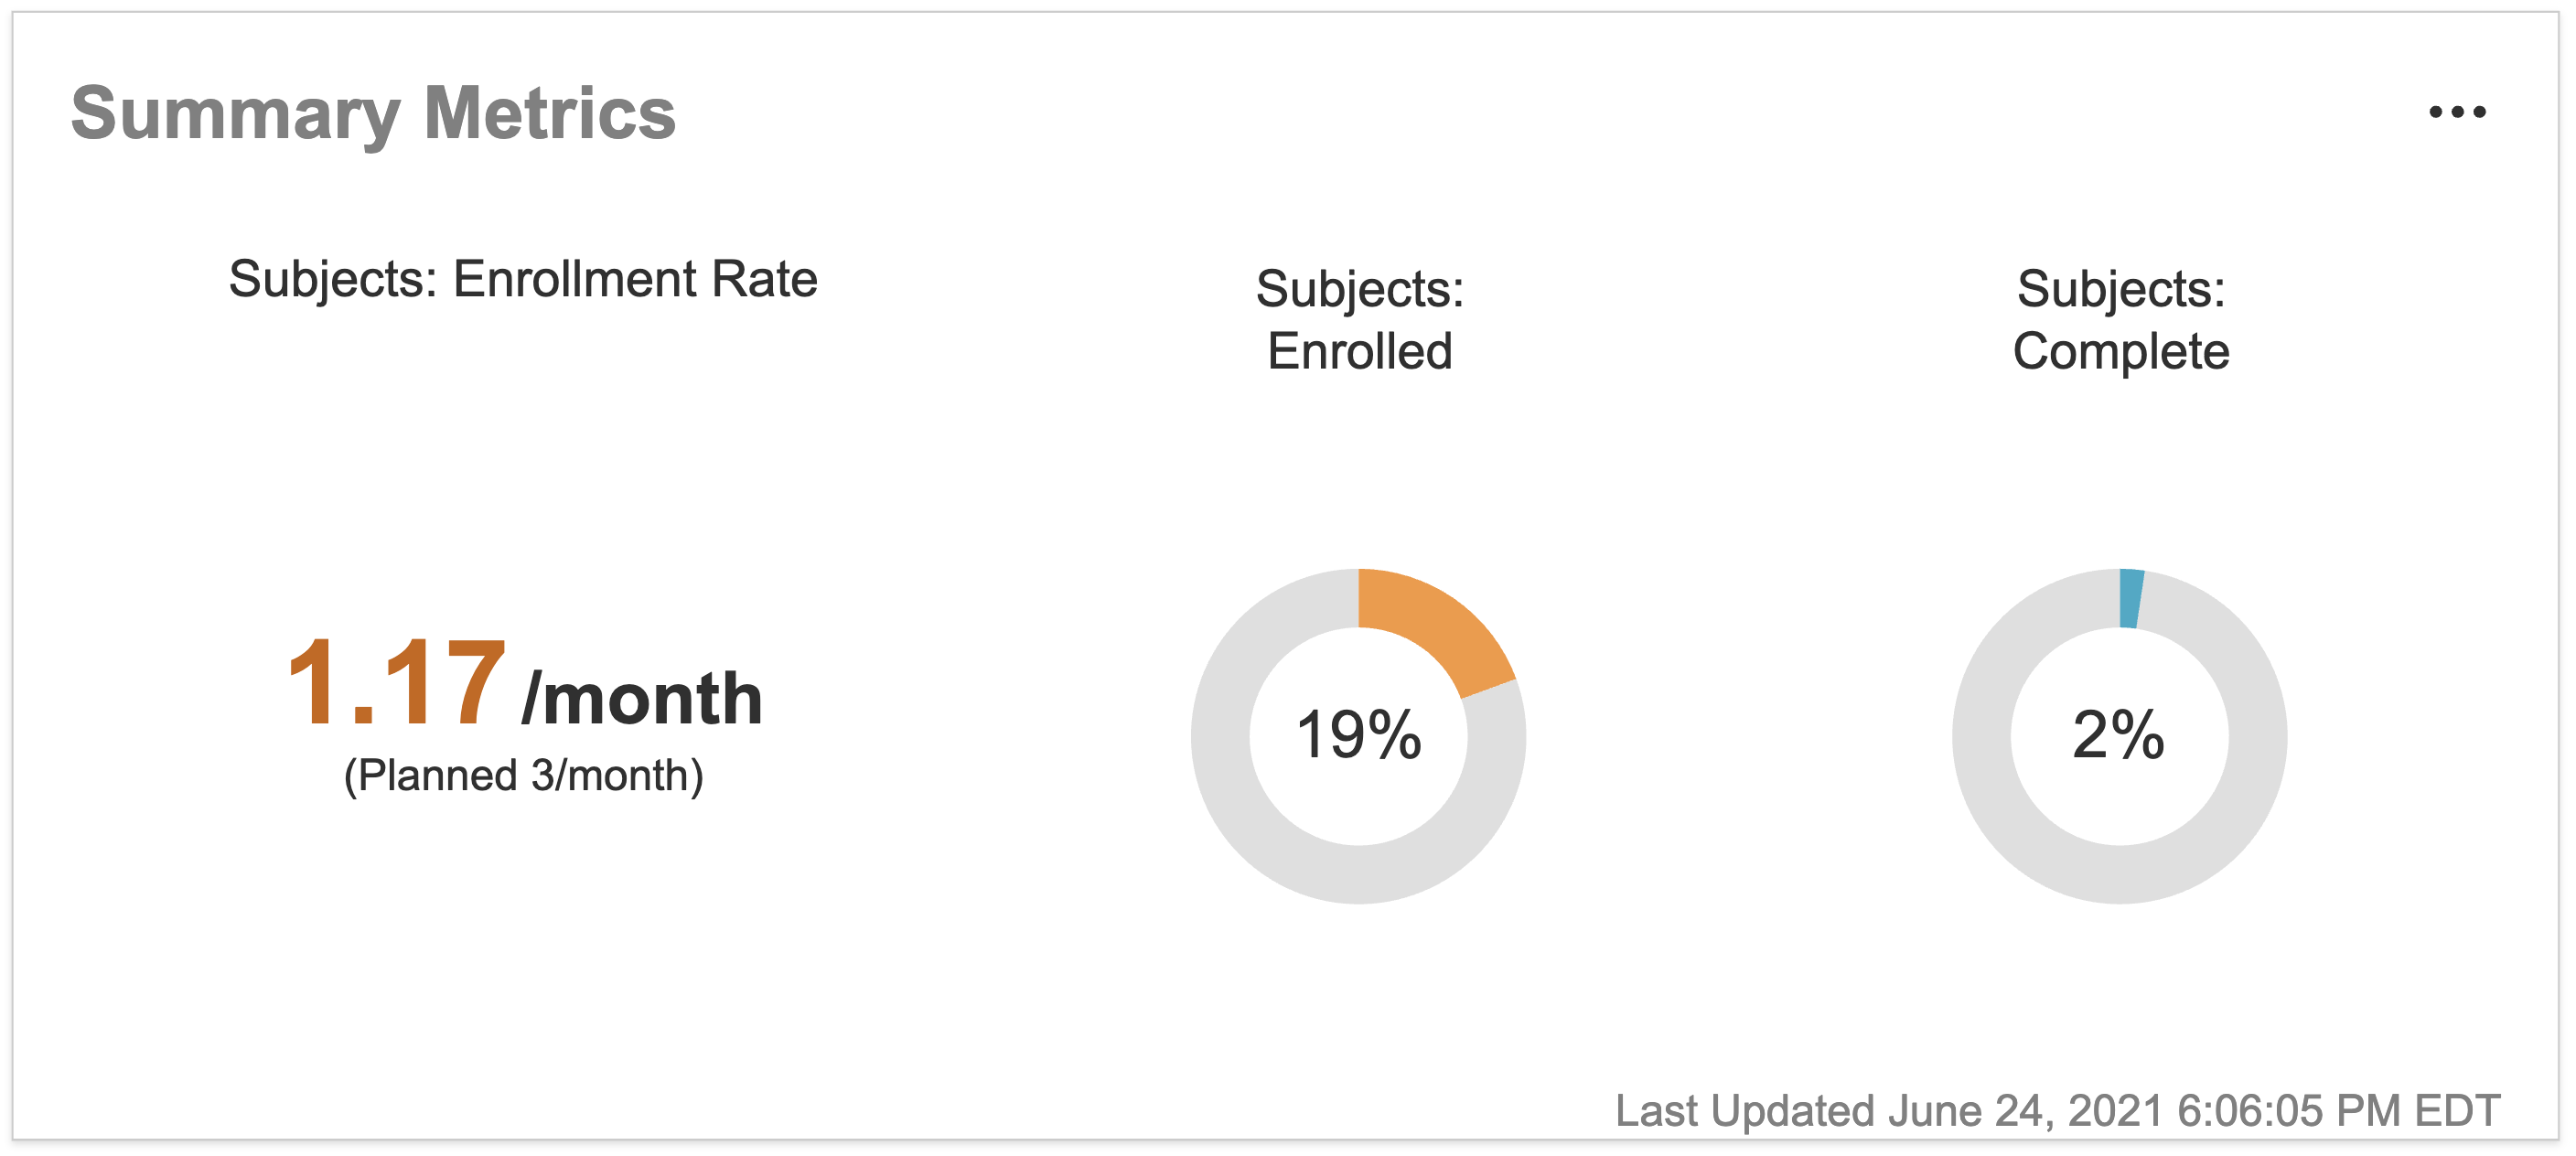
If you hover over the **Subjects: Enrolled** or **Subjects: Complete** charts, a hovercard displays the actual enrollment number, the planned enrollment number, and the forecast enrollment.
You can edit the related _Metric_ or _Subject_ object records from the **Summary Metrics** widget.
1. From the **Actions** menu in the **Summary Metrics** widget, select **Summary Metrics** or **Subject Status**.
2. Vault displays a filtered list of either _Metric_ or _Subject_ records. Make any necessary edits.
3. Click **Save**.
Note that the labels in this widget reflect your Vault's _Subject Label_ and the values defined in the _Subject Status_ picklist.
### Monitoring Plan
The **Monitoring Plan** widget displays the record list page for the _Monitoring Event_ (`monitoring_event__ctms`) object. From this widget, you can perform bulk object record actions, inline edit your records, and create and relate object records.
### My Tasks
The **My Tasks** widget displays a simplified view of the Vault Home **My Tasks** page. This widget shows your assigned _Clinical User Tasks_, document workflow tasks, object workflow tasks, and envelope tasks on the following objects: _Issues_ (`pdv__ctms`), _Study Communication Logs_, and _Responses_ for the selected study, study country, or study site.
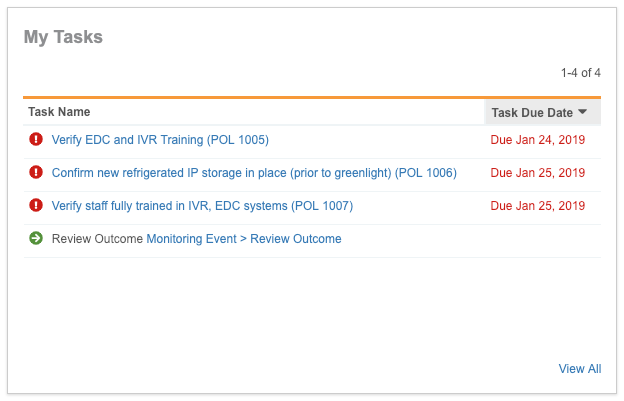 From the **Actions** menu in this widget, you can choose to **Complete** tasks or **Undo Acceptance** (workflow tasks only).
### Enrollment Status Graph
The _Enrollment Status_ graph displays the enrollment history and projected enrollment for your _Study_, _Study Country_, or _Study Site_.
From the **Actions** menu in this widget, you can choose to **Complete** tasks or **Undo Acceptance** (workflow tasks only).
### Enrollment Status Graph
The _Enrollment Status_ graph displays the enrollment history and projected enrollment for your _Study_, _Study Country_, or _Study Site_.
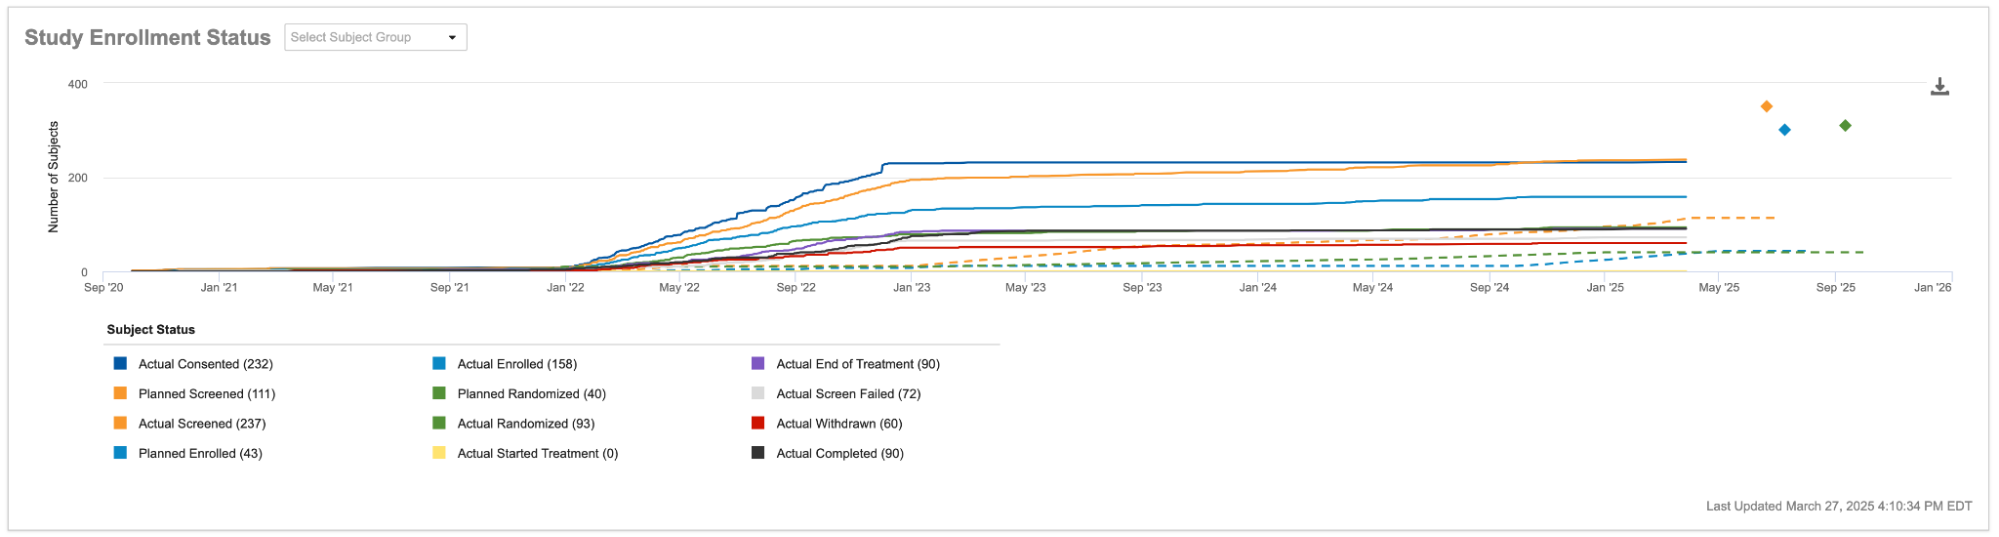 The first date on the X-axis is the _Current Planned FSI_ date, and the last date on the X-axis is the _Current Planned LSO_ date. The Y-axis represents the number of subjects. Your Vault's _Subject Label_ displays in the X- and Y-axis labels. The _Subject Status_ legend identifies the different lines on the graph.
For _Studies_ where users manually enter values for the _Forecasted_ fields of _Metrics Over Time_ records, the _Enrollment Status_ graph displays those _Forecasted_ values as well.
For _Studies_ tracking _Enrollment Metrics_ for _Subject Groups_, select a **Subject Group** from the picklist to filter the _Enrollment Status Graph_.
Vault alerts you when your graph is missing data:
The first date on the X-axis is the _Current Planned FSI_ date, and the last date on the X-axis is the _Current Planned LSO_ date. The Y-axis represents the number of subjects. Your Vault's _Subject Label_ displays in the X- and Y-axis labels. The _Subject Status_ legend identifies the different lines on the graph.
For _Studies_ where users manually enter values for the _Forecasted_ fields of _Metrics Over Time_ records, the _Enrollment Status_ graph displays those _Forecasted_ values as well.
For _Studies_ tracking _Enrollment Metrics_ for _Subject Groups_, select a **Subject Group** from the picklist to filter the _Enrollment Status Graph_.
Vault alerts you when your graph is missing data:
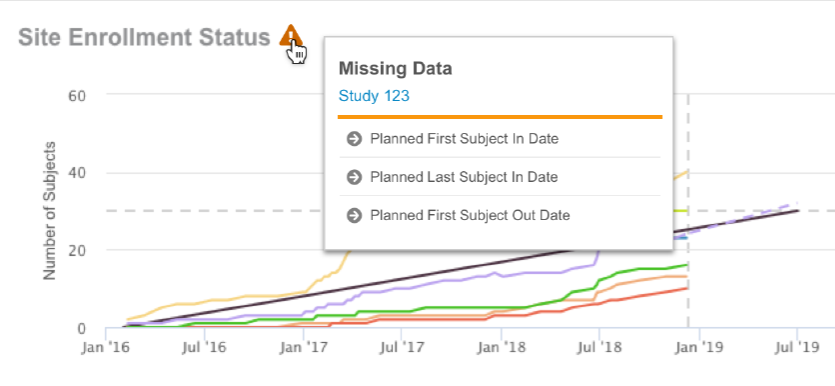 Hover over the hazard sign icon to see what data is missing.
For a more in-depth explanation of how Vault compiles and displays enrollment metrics, see [Subject & Enrollment Metrics](/en/lr/52876/).
### Study Quality {#study-quality}
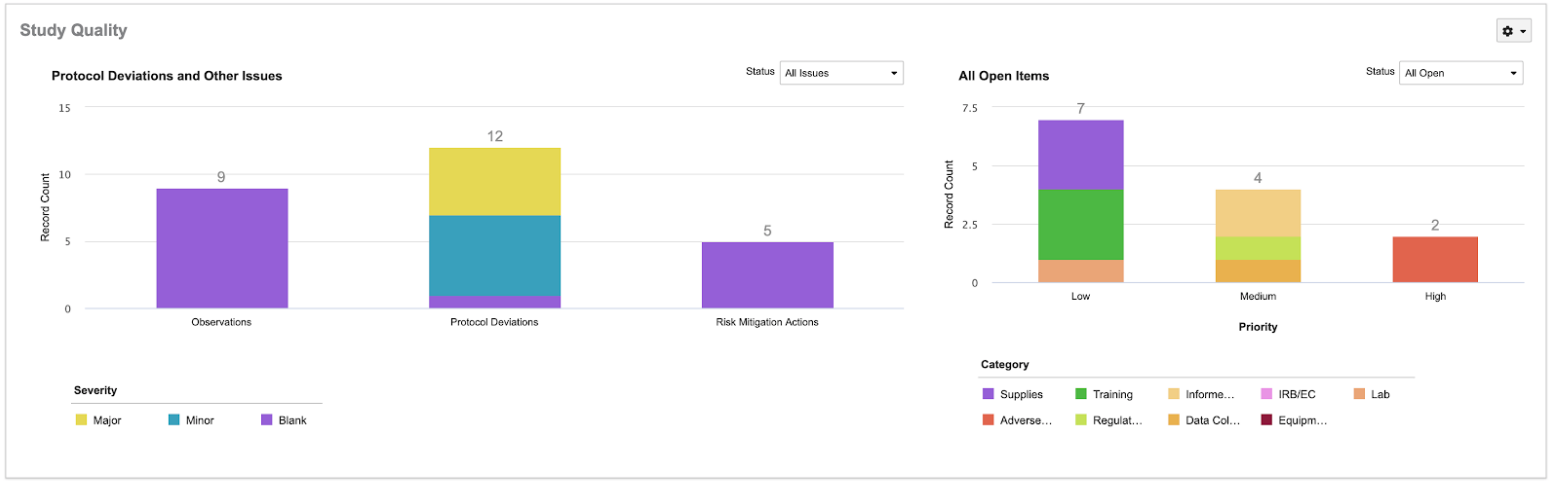
The **Study Quality** (**Country Quality** or **Site Quality**) widget contains two bar charts: **Protocol Deviations and Other Issues** and **All Open Items**. In the **Protocol Deviations and Other Issues** bar chart, each bar represents the number of _Issues_ at the selected level (Study, Study Country, or Study Site) that have values in the _Study Site_ field, stacked by _Severity_. _Issues_ that do not track _Severity_ are denoted with a "Blank" category. The **Country Quality** and **Site Quality** widgets include a bar representing the average number of _Issues_ at that level.
The **All** **Open Items** bar chart shows the number and status of _Clinical User Tasks_ at the selected level that have values in the _Study Site_ field. There is a bar for each _Severity_ level, stacked by _Category_. You can choose to display only follow up items with a certain _Status_ by selecting from the **Status** drop-down. By hovering over a bar, you can display a list of record counts for each _Category_ of _Clinical User Task_.
Note that the X-axis labels in this widget reflect the **Plural Labels** of your Vault's _Issue_ object types.
You can use the **Actions** menu in this widget to create _Clinical User Tasks_ and _Issues_.
Hover over the hazard sign icon to see what data is missing.
For a more in-depth explanation of how Vault compiles and displays enrollment metrics, see [Subject & Enrollment Metrics](/en/lr/52876/).
### Study Quality {#study-quality}
The **Study Quality** (**Country Quality** or **Site Quality**) widget contains two bar charts: **Protocol Deviations and Other Issues** and **All Open Items**. In the **Protocol Deviations and Other Issues** bar chart, each bar represents the number of _Issues_ at the selected level (Study, Study Country, or Study Site) that have values in the _Study Site_ field, stacked by _Severity_. _Issues_ that do not track _Severity_ are denoted with a "Blank" category. The **Country Quality** and **Site Quality** widgets include a bar representing the average number of _Issues_ at that level.
The **All** **Open Items** bar chart shows the number and status of _Clinical User Tasks_ at the selected level that have values in the _Study Site_ field. There is a bar for each _Severity_ level, stacked by _Category_. You can choose to display only follow up items with a certain _Status_ by selecting from the **Status** drop-down. By hovering over a bar, you can display a list of record counts for each _Category_ of _Clinical User Task_.
Note that the X-axis labels in this widget reflect the **Plural Labels** of your Vault's _Issue_ object types.
You can use the **Actions** menu in this widget to create _Clinical User Tasks_ and _Issues_.
 ## Related Permissions
You must have at least _View_ permission on the following objects to see the CRA Homepage components.
* _Study_, _Study Country_, and _Study Site_
* _Metrics_
* _Monitoring Event_
* _Enrollment Status Log_
* _Clinical User Task_
* _Monitoring Follow Up Item_
* _Study Communication Log Item_
## Related Permissions
You must have at least _View_ permission on the following objects to see the CRA Homepage components.
* _Study_, _Study Country_, and _Study Site_
* _Metrics_
* _Monitoring Event_
* _Enrollment Status Log_
* _Clinical User Task_
* _Monitoring Follow Up Item_
* _Study Communication Log Item_