The CRA Homepage provides a single page to view key information for Clinical Research Associates (CRAs), including site status, enrollment metrics, and monitoring data at the Study, Study Country, and Study Site levels. With the CRA Homepage, you can quickly identify actions needed, assess the status of your sites, and navigate to and interact with your data.
Note: This feature is only available on Clinical Operations CTMS Vaults.
Study Selector
Vault shows metrics for the study you choose from the context selector. You can narrow your search further by selecting a study country and site. For example, if you select Study: AVEG 027 > Study Country: United States > Study Site: US-101, all components of your homepage will be specific to the study site, US-101.
CRA Homepage Components
The CRA Homepage contains the following components:
Details
The details widget displays details about the Study, Study Country, or Study Site you selected in the context selector. Vault displays the details for the lowest record in the study hierarchy. For example, if Teresa selected the Study Country record, France, she would see the Country Details information widget for France.
You can use the Actions menu in this widget to create a Study Communication Log.
Summary Metrics
The Summary Metrics widget displays key enrollment metrics for your Study Site: Subject Enrollment Rate, Subjects Enrolled, and Subjects Complete.
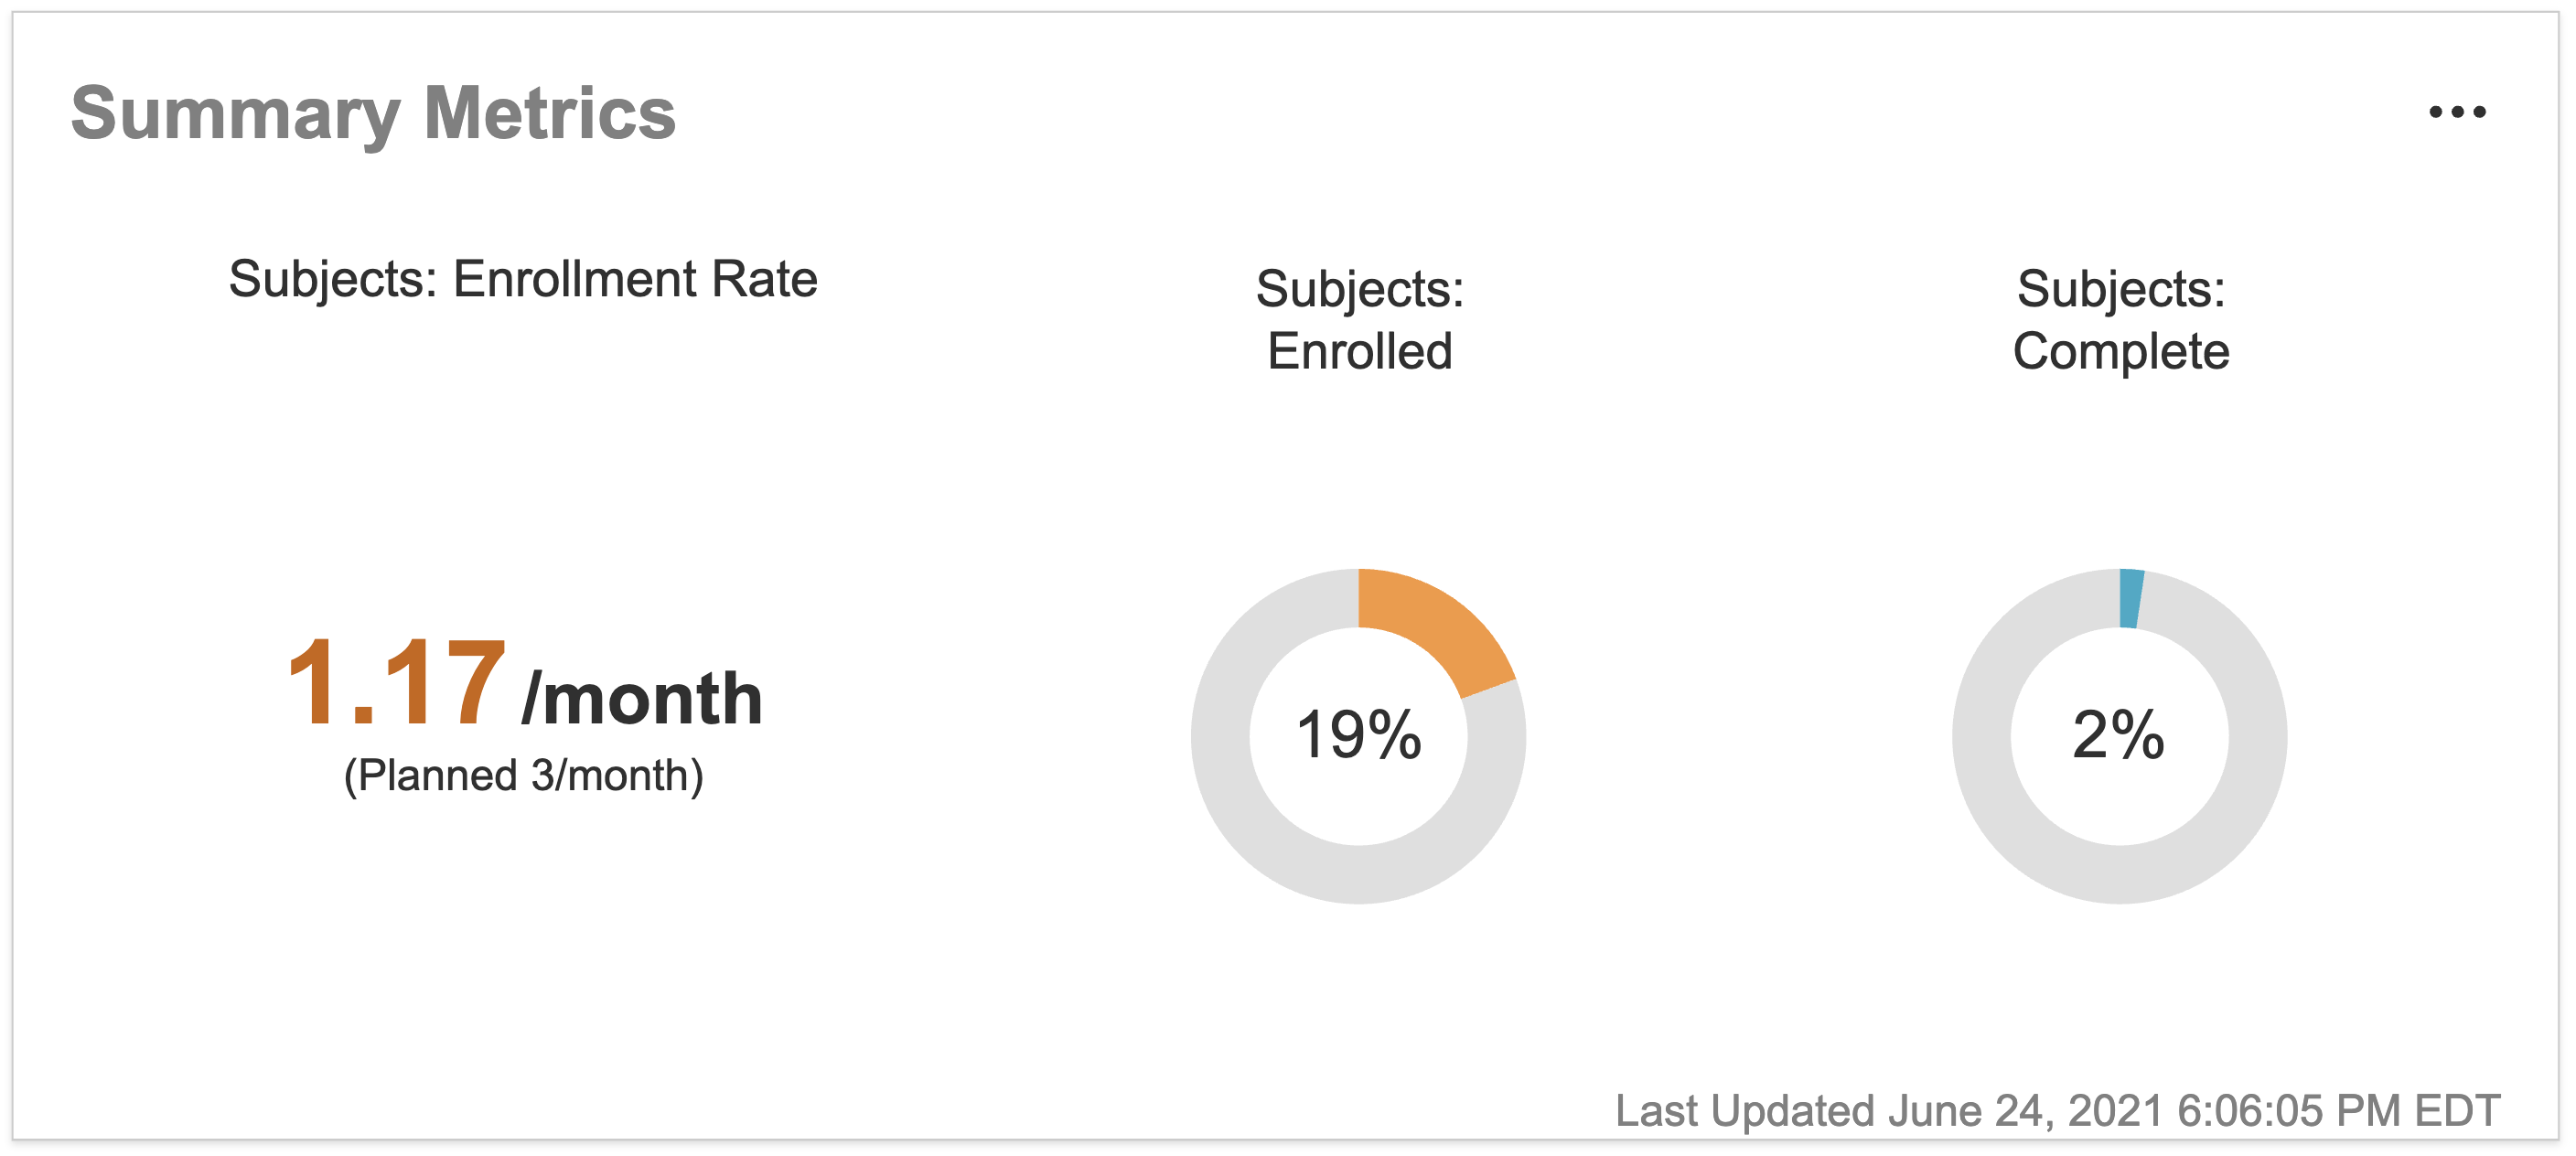
If you hover over the Subjects: Enrolled or Subjects: Complete charts, a hovercard displays the actual enrollment number, the planned enrollment number, and the forecast enrollment.
You can edit the related Metric or Subject object records from the Summary Metrics widget.
- From the Actions menu in the Summary Metrics widget, select Summary Metrics or Subject Status.
- Vault displays a filtered list of either Metric or Subject records. Make any necessary edits.
- Click Save.
Note that the labels in this widget reflect your Vault’s Subject Label and the values defined in the Subject Status picklist.
Monitoring Plan
The Monitoring Plan widget displays the record list page for the Monitoring Event (monitoring_event__ctms) object. From this widget, you can perform bulk object record actions, inline edit your records, and create and relate object records.
My Tasks
The My Tasks widget displays a simplified view of the Vault Home My Tasks page. This widget shows your assigned Clinical User Tasks, document workflow tasks, object workflow tasks, and envelope tasks on the following objects: Issues (pdv__ctms), Study Communication Logs, and Responses for the selected study, study country, or study site.
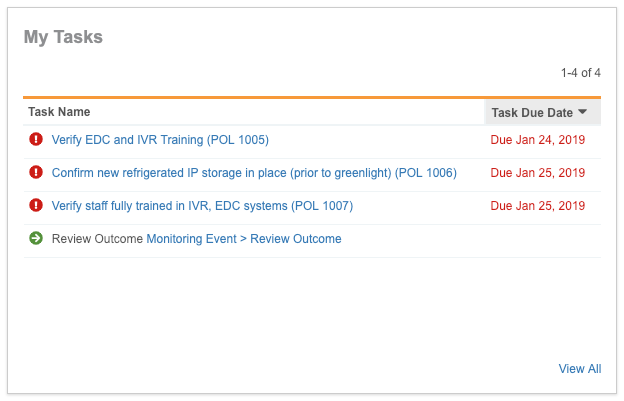
From the Actions menu in this widget, you can choose to Complete tasks or Undo Acceptance (workflow tasks only).
Enrollment Status Graph
The Enrollment Status graph displays the enrollment history and projected enrollment for your Study, Study Country, or Study Site.
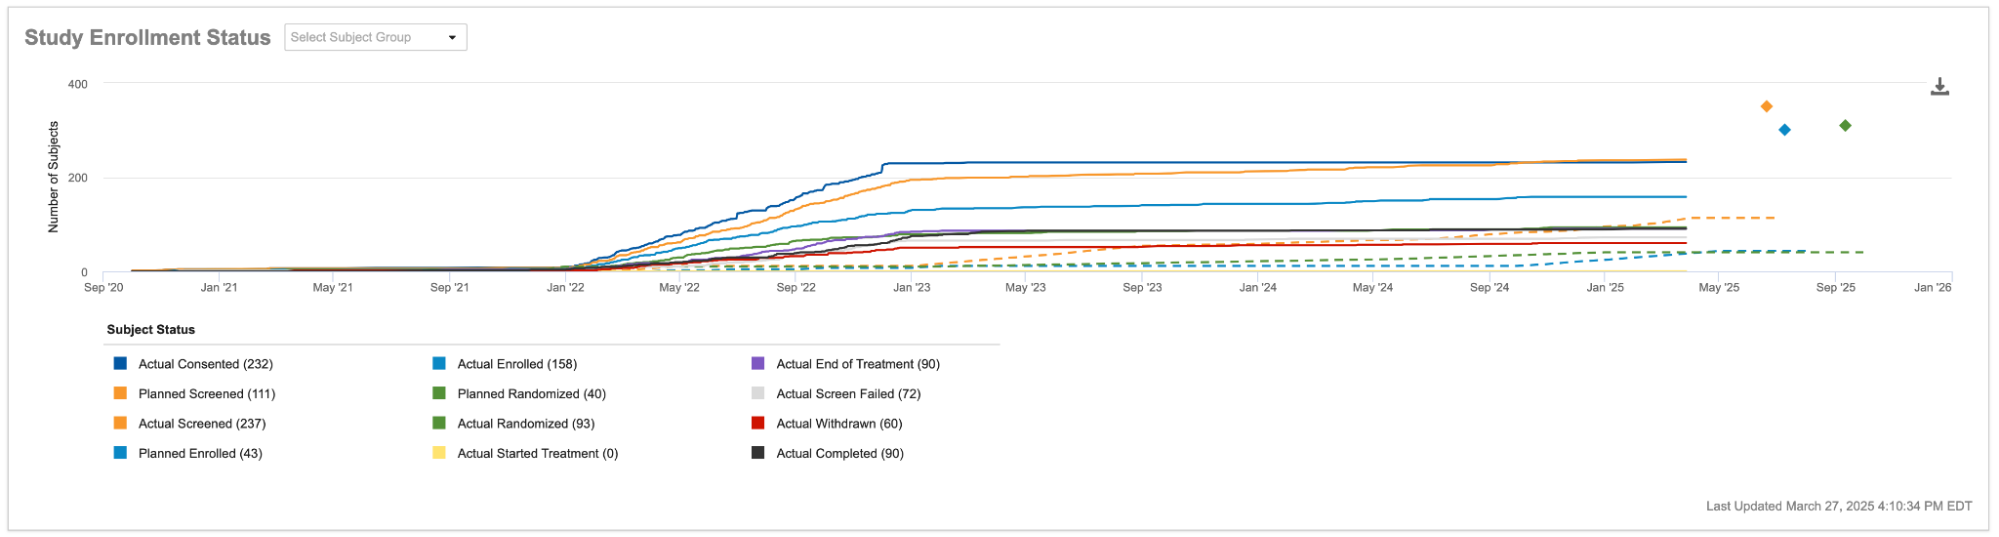
The first date on the X-axis is the Current Planned FSI date, and the last date on the X-axis is the Current Planned LSO date. The Y-axis represents the number of subjects. Your Vault’s Subject Label displays in the X- and Y-axis labels. The Subject Status legend identifies the different lines on the graph.
For Studies where users manually enter values for the Forecasted fields of Metrics Over Time records, the Enrollment Status graph displays those Forecasted values as well.
For Studies tracking Enrollment Metrics for Subject Groups, select a Subject Group from the picklist to filter the Enrollment Status Graph.
Vault alerts you when your graph is missing data:
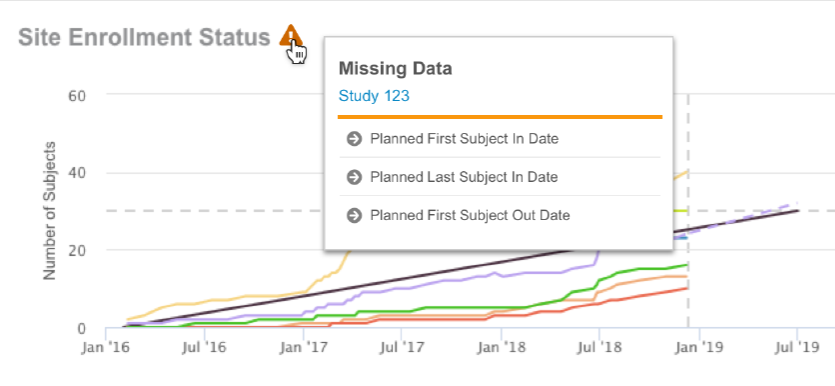
Hover over the hazard sign icon to see what data is missing.
For a more in-depth explanation of how Vault compiles and displays enrollment metrics, see Subject & Enrollment Metrics.
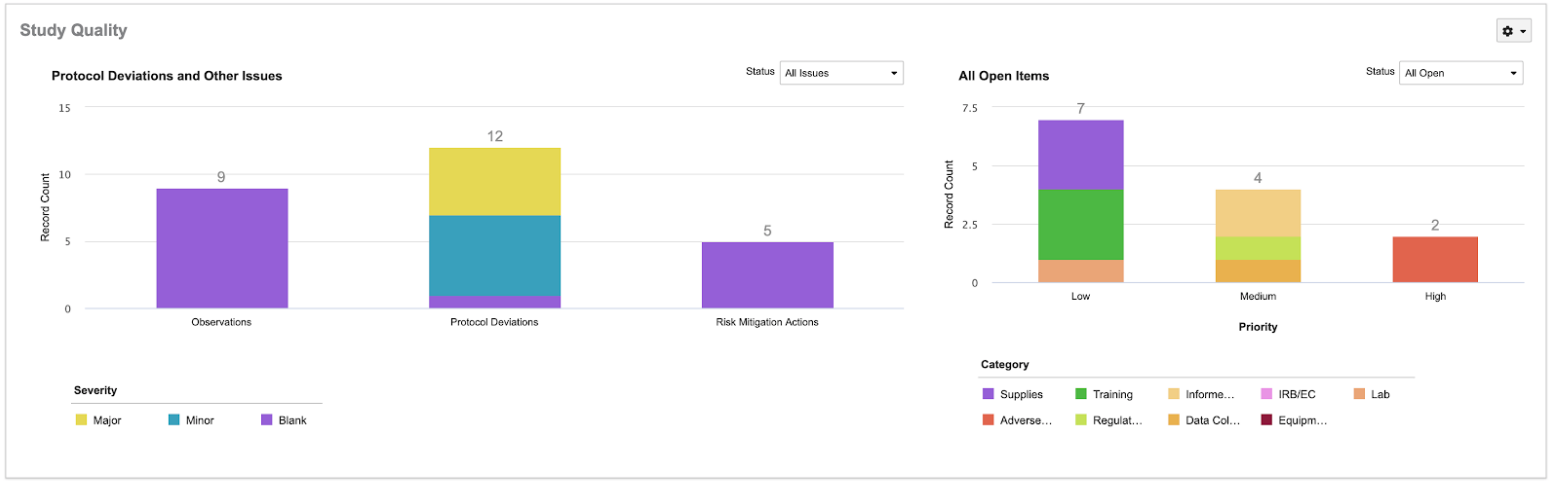
Study Quality
The Study Quality (Country Quality or Site Quality) widget contains two bar charts: Protocol Deviations and Other Issues and All Open Items. In the Protocol Deviations and Other Issues bar chart, each bar represents the number of Issues at the selected level (Study, Study Country, or Study Site) that have values in the Study Site field, stacked by Severity. Issues that do not track Severity are denoted with a “Blank” category. The Country Quality and Site Quality widgets include a bar representing the average number of Issues at that level.
The All Open Items bar chart shows the number and status of Clinical User Tasks at the selected level that have values in the Study Site field. There is a bar for each Severity level, stacked by Category. You can choose to display only follow up items with a certain Status by selecting from the Status drop-down. By hovering over a bar, you can display a list of record counts for each Category of Clinical User Task.
Note that the X-axis labels in this widget reflect the Plural Labels of your Vault’s Issue object types.
You can use the Actions menu in this widget to create Clinical User Tasks and Issues.
Related Permissions
You must have at least View permission on the following objects to see the CRA Homepage components.
- Study, Study Country, and Study Site
- Metrics
- Monitoring Event
- Enrollment Status Log
- Clinical User Task
- Monitoring Follow Up Item
- Study Communication Log Item