The Study Management Homepage provides a single page to view key information for Study Managers, including study status, enrollment metrics, and monitoring data at the Study, Study Country, and Study Site levels. With the Study Management Homepage, you can quickly identify actions needed, assess the status of your sites, and navigate to and interact with your data.
Note: This feature is only available on Clinical Operations CTMS Vaults.
Study Selector
Vault shows metrics for the study you choose from the context selector. You can narrow your search further by selecting a study country and site. For example, if you select Study: AVEG 027 > Study Country: United States > Study Site: US-101, all components of your homepage will be specific to the study site, US-101.
Study Management Homepage Components
The Study Management Homepage contains the following components:
Summary Metrics
The summary metrics widget displays key enrollment metrics for your Study Site: Subject Enrollment Rate, Subjects Enrolled, and Subjects Complete.
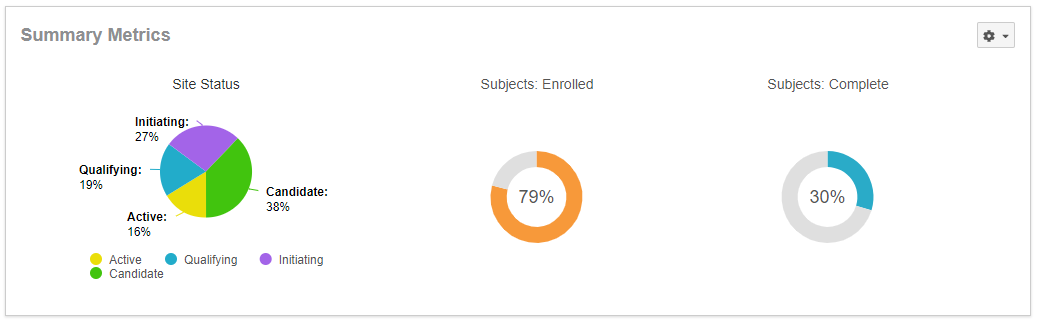
If you hover over the Subjects: Enrolled or Subjects: Complete charts, a hovercard displays the actual metric number, the planned metric number, and the forecast metric number.
You can edit the related Metric and Subject object records directly from the Summary Metrics widget:
- From the Actions menu in the Summary Metrics widget, select Summary Metrics or Subject Status.
- Vault displays a filtered list of either Metric or Subject records. Make any necessary edits.
- Click Save.
Note that the labels in this widget reflect your Vault’s Subject Label and the values defined in the Subject Status picklist.
Monitoring Compliance
With the Monitoring Compliance widget, you can easily view your overdue monitoring visits and late trip reports.
Prior to the 19R2.0 release, Vault calculated Monitoring Compliance based on the Compliant MVR? field on the document. As of the 19R2.0 release, Vault pulls this data from the Compliant MVR? field on the associated Monitoring Event object record.
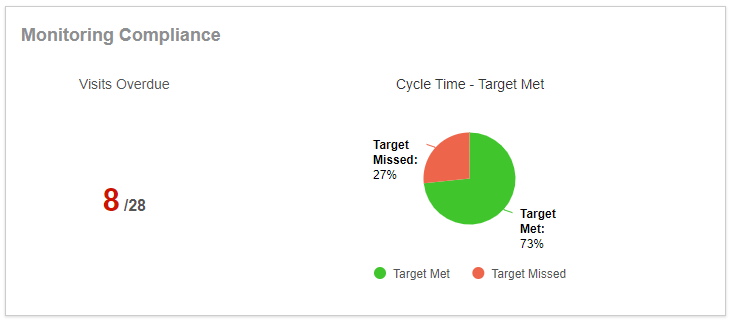
The red number below Visits Overdue is the number of monitoring visits with a planned or baseline start date before today’s date and no actual start date. The black number below Visits Overdue is for all Expected Visits, which is the total number of planned and confirmed visits.
The Cycle Time – Target Met pie chart displays the percentage of monitoring visit reports that are compliant and not compliant. Hover over the pie chart to see the most recent Monitoring Compliance details at the level you selected in the context selector.
My Tasks
The My Tasks widget displays a simplified view of the Vault Home My Tasks page. This widget shows your assigned Study Site Tasks, Monitoring Follow up Items, document workflow tasks, object workflow tasks, and envelope tasks on the following objects: Protocol Violations or Deviations, Study Communication Logs, and Responses for the selected Study, Study Country, or Study Site.
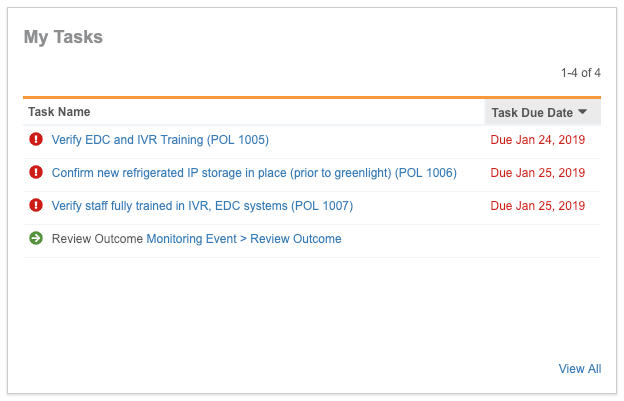
From the Actions menu in this widget, you can Complete tasks or Undo Acceptance (workflow tasks only).
Monitoring Status
The Monitoring Status widget displays the current statuses associated with each type of Monitoring Event.
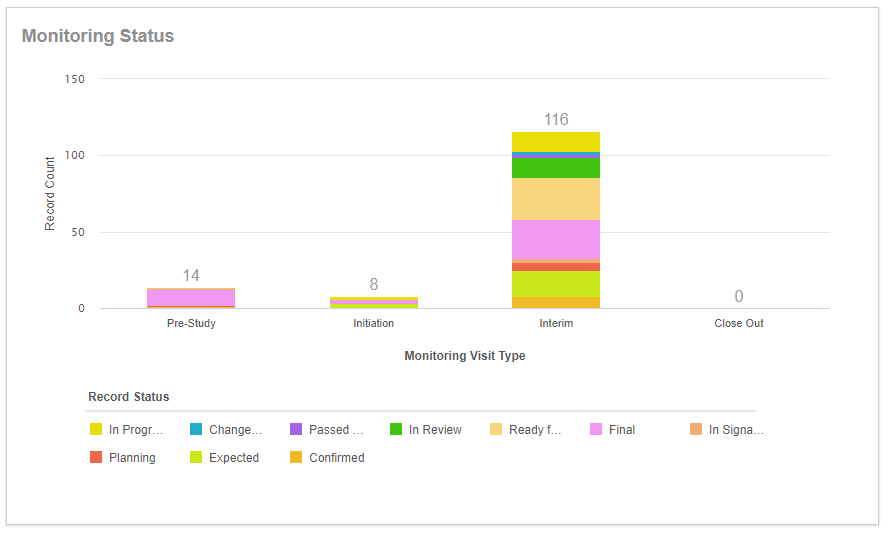
If you hover over a bar, the hovercard displays the lifecycle states that records are currently in and the count of records in each lifecycle state.
Milestone Status
The Milestone Status widget displays a list of Milestone object records. Select a Milestone Category to filter the list of Milestones displayed.
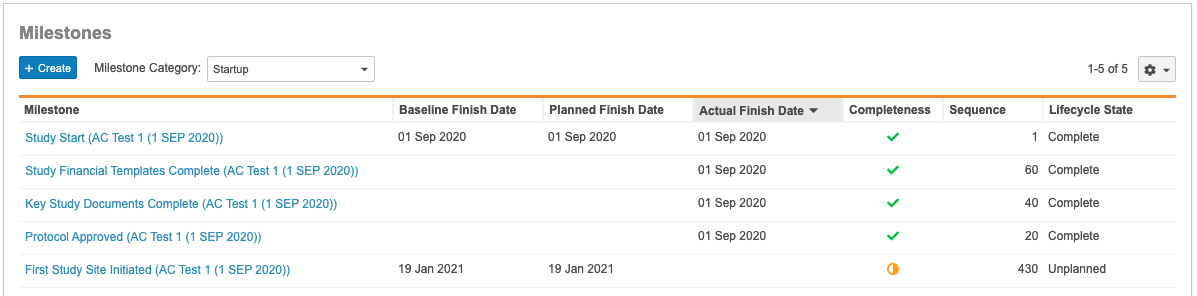
From this widget, you can perform bulk object actions, inline edit your records, and create and relate object records.
The name of the Milestone widget reflects the plural label of the Milestone object, which may be different if it has been configured by your Admin.
Configuring the Milestone Category Picklist
Add picklist values to the Milestone Category picklist so that users can filter the list of Milestones displayed in the Milestones widget.
Enrollment Status Graph
The Enrollment Status graph displays the enrollment history and projected enrollment for your Study, Study Country, or Study Site.
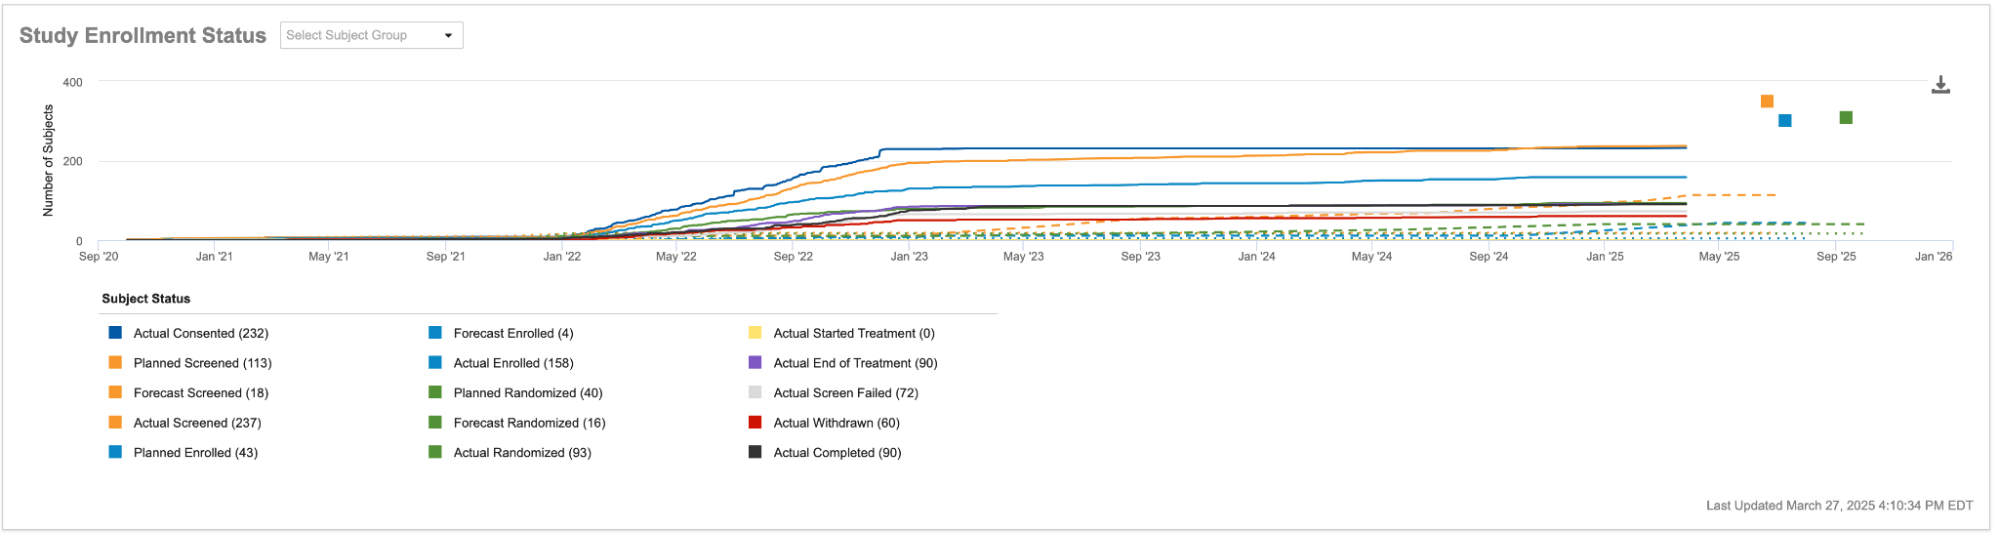
The first date on the X-axis is the Current Planned FSI date, and the last date on the X-axis is the Current Planned LSO date. The Y-axis represents the number of subjects. Your Vault’s Subject Label displays in the X- and Y-axis labels. The Subject Status legend identifies the different lines on the graph.
For Studies where users manually enter values for the Forecasted fields of Metrics Over Time records, the Enrollment Status graph displays those Forecasted values as well.
For Studies tracking Enrollment Metrics for Subject Groups, select a Subject Group from the picklist to filter the Enrollment Status Graph.
Vault alerts you when your graph is missing data:
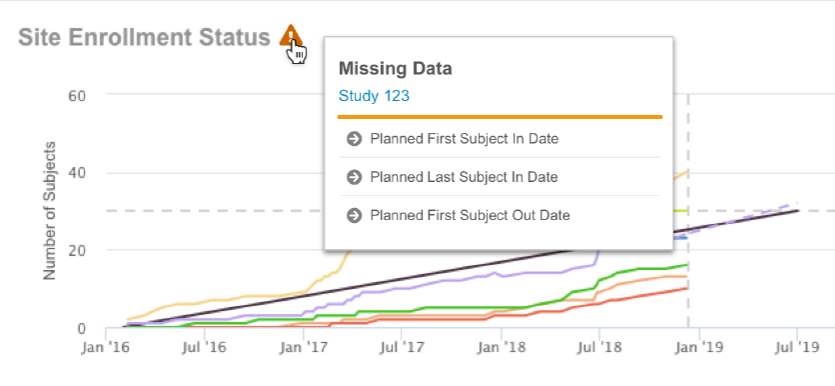
Hover over the hazard sign icon to see what data is missing.
For a more in-depth explanation of how Vault compiles and displays enrollment metrics, see Subject & Enrollment Metrics.
Related Permissions
You must have at least View permission on the following objects to see the Study Management Homepage components:
- Study, Study Country, and Study Site
- Clinical User Task
- Metrics
- Monitoring Visit
- Monitoring Event
- Monitoring Compliance
- Milestone
- Enrollment Status Log