Note: If you are unable to locate the answers you need, please see our TMF Bot FAQ.
Note: This article’s contents are specific to TMF Bot and do not apply to RIM Bot, a separate Vault AI feature. Users seeking information for the RIM Bot can reference Evaluating RIM Bot Auto-Classification Models.
After training an auto-classification model for TMF Bot, there is a great deal of data available to help you evaluate the effectiveness of your Trained Models. This article explains how to use our Key Metrics to evaluate your Trained Models, defines each Trained Model Artifact they provide, and describes how to identify issues and improve your model training.
Auto-classification Evaluation Key Metrics
Key Metrics Definitions
There are three Key Metrics to ensure your Trained Model is effective: Extraction Coverage, Auto-classification Coverage, and Auto-classification Error Rate. This section contains a basic description of each and some suggested targets and real-world example values based on an actual Trained Model.
| Metric | Definition | What drives this result? | Suggested Target | Example |
| Extraction Coverage | The number of documents that had appropriate information to train the model | Documents that fit our extraction criteria (extractable text) | 50–90%, with the lower end being appropriate for non-English customers | An enterprise customer trained a model on 200,000 of their latest documents; their Extraction coverage was 85.34% |
| Auto-classification Coverage | The number of documents that had a prediction above your Prediction Confidence Threshold | Your Prediction Confidence Threshold, as well as the number and accuracy of documents used for training | 45–95%, with the lower end being appropriate for customers who train with a small number of documents (<5,000) | A customer with a .90 Prediction Confidence Threshold was able to achieve 94% Auto-classification Coverage, whereas the same customer with a .99 Prediction Confidence Threshold had 89.65% Auto-classification Coverage |
| Auto-classification Error Rate | Documents with predictions above your Prediction Confidence Threshold that were incorrectly classified | Your Prediction Confidence Threshold, as well as the number and accuracy of documents used for training | Your target for this will depend on how risk-averse your organization is. Typically, lower is better, but keep in mind:
|
A customer with a .90 Prediction Confidence Threshold had a .58% Auto-classification Error Rate, whereas the same customer with a .99 Prediction Confidence Threshold was able to achieve a .28% Auto-classification Error Rate |
Using Key Metrics for Evaluation
In the section above, we introduced three Key Metrics to evaluating the effectiveness of your Trained Model. You can locate them in the Training Summary Results field.
Extraction Coverage
Extraction coverage is the only Key Metric that you cannot improve. While this might be disconcerting, the purpose of this metric is to set the right expectations for documents added to the Document Inbox. If your company has many audio, video, or other non-text files; a significant number of non-English documents; or regular problems with blurry scans, this metric can help you understand why particular documents are not auto-classified in the Document Inbox.
Improving Auto-classification Coverage
You can improve your Auto-classification Coverage metric via the following methods:
- Lower your Prediction Confidence Threshold: A lower Prediction Confidence Threshold may allow more documents to be covered by auto-classification, but be aware that it may raise your Auto-classification Error Rate.
- Evaluate outliers within the Model Result Confusion Matrix: Outliers are not on the matrix’s diagonal. You may find that there is regularly occurring confusion for some document types that you can reduce by reclassifying documents within your Vault or by excluding a particular document type from training. You will need to train a new Trained Model record to capture these changes.
Note: Users cannot edit the Prediction Confidence Threshold for system-trained models.
Improving Auto-classification Error Rate
You can improve your Auto-classification Error Rate metric via the following methods:
- Raise your Prediction Confidence Threshold: A higher Prediction Confidence Threshold may reduce your error rate as the model will be more confident in its auto-classification, but be aware that it may reduce your Auto-classification Coverage as well.
- Evaluate documents within the Model Results Individual Predictions CSV that are above your Prediction Confidence Threshold but are misclassified. Evaluating these documents in your Vault may reveal that the TMF Bot was correct, and the document was actually misclassified. Or, if the TMF Bot was still wrong, it may help you understand why that was the case.
Finishing Evaluation
Once you have evaluated the Key Metrics for your Trained Model, you can compare them against our suggested targets and form your own company targets. If your Trained Model meets or exceeds your set target, this would be good Trained Model to deploy.
Trained Model Performance Metrics
Every Trained Model has a series of Trained Model Performance Metrics records once training has been completed. You can find these in the Model Performance Metrics section of your Trained Model record. There are three Metric Types for Document Classification Trained Models:
- Global Weighted Average: Contains average Precision, Recall, and F1-Score weighted by the number of documents in each classification.
- Global Non-Weighted Average: Contains average Precision, Recall, and F1-Score across all classifications regardless of the number of documents in each classification.
- Classification Performance: Contains the Precision, Recall, and F1-Score for the document type listed in the Metric Subtype.
- A special OTHERS UNKNOWN Classification Performance record catches the documents with classifications that didn’t meet the Minimum Documents per Document Type threshold. These documents are still used in training but are grouped together to better inform predictions on the valid classifications.
Each record shows the following metrics:
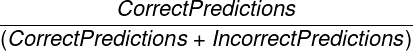
- Precision: How often the prediction made was accurate
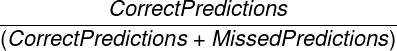
- Recall: Percentage of items within this Metric Subtype that were correctly predicted
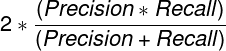
- F1-Score: The balance between Precision and Recall
- Training Documents: The number of documents used for training the model. It will be 80% of the total documents used as input. This 80% is randomly selected within each classification.
- Testing Documents: The number of documents used for testing the model. This is the remaining 20% of the total documents used as input.
- Correct Predictions: The total number of times the model correctly predicted a classification regardless of the prediction confidence.
- Predictions above Threshold: The total number of predictions above the Prediction Confidence Threshold selected on this Trained Model.
- Correct Predictions above Threshold: The total number of correct predictions above the Prediction Confidence Threshold selected on this Trained Model.
It is important to note that all predictions marked as correct assume the inputs are classified correctly. Any misclassified documents used to train the model may lead to inaccurate auto-classification. The Trained Model Artifacts listed below can help reveal potential issues.
Trained Model Artifacts
Trained Models have a series of Trained Model Artifacts attached, each containing valuable data. You can find these on a Trained Model object record in the Trained Model Artifacts section. The artifacts include the following files for Trained Models using the Document Classification type:
- Document Set Extract Results (documentset_extract_results.csv): Extraction results for each document requested for training this model.
- This file is most helpful in seeing why some documents were not used during the training process.
- You can use the Document ID & Major/Minor Version within this file to view the appropriate document within Vault.
- See Reasons for Extraction Failures below for a list of potential failure reasons.
- Model Results Confusion Matrix (model_results_confusion_matrix.csv): Compares the actual classification of documents (the X-axis) to TMF Bot’s predicted classification (the Y-axis)
- The diagonal should have the highest numbers, as this is where the true classification and predicted classification intersect.
- Numbers above and below the diagonal indicate confusion. You should investigate classifications with larger numbers of incorrect predictions to understand the reason for the Trained Model confusion.
- Model Results Document Type Frequency (model_results_doctype_frequency.csv): Lists all the document types used, the total documents used from each, and the numbers used for training (80%) and testing (20%), respectively. Classifications below the Minimum Documents per Document Type are grouped into OTHERS UNKNOWN.
- Model Results Individual Predictions (model_results_individual_predictions.csv): Shows the true document type, encoded document type, top three predictions, and the top three prediction scores for each document, and if the document was misclassified.
- The True Document Type column lists the actual classification from Vault. The Encoded Document Type column shows what you provided to the model: The actual classification or OTHERS UNKNOWN, the latter being for those document types with less than the Minimum Documents per Document Type on the Trained Model.
- The file shows three Prediction Scores, one for each Document Type Prediction. Auto-classification only uses the First Prediction Score. If this score is above the Prediction Confidence Threshold, that document would have been auto-classified. The second and third scores are for informational purposes only.
- Lastly, Misclassified shows if the Encoded Document Type and the First Document Type Prediction match or not. Filtering to see the Misclassified items can quickly reveal potential issues with your existing documents. For example, if the Trained Model has a First Prediction Score of .9999887 and was misclassified, the document may actually be misclassified in your Vault.
- Model Results Performance Metrics (model_results_performance_metrics.csv): A CSV version of the Model Performance Metrics data on this record.
- Model Results Training Set (model_results_training_set.csv): Lists the individual documents used for training (the 80% of the entire set of documents) and their classifications. This file can be helpful if you want to review the documents used to train a specific classification, especially if you notice that classification is often misclassified.
Reasons for Extraction Failures
The Document Set Extract Results CSV file gives one of the following reasons for an extraction failure:
- Language Not Detected: The system could not detect a language
- Language Not Supported: The language detected was not English
- Not Confident in Language Detection: The system was not confident in its language detection
- No Text Available: The document had no extractable text
- OCR failed for PDF: Optical character recognition (OCR) could not complete for a PDF file
- OCR failed for Complex Image: OCR could not complete for a complex image format, such a TIFF
- OCR failed for Simple Image: OCR could not complete for a simple image format, such as PNG or JPG
- PDF Rendering failed: TMF Bot could not render the document as a PDF
- Current Document Type is Inactive: The document type for this document is no longer active
- Steady State not Found: The document does not have a steady state version
- This Document Type is Intentionally Excluded: Document was a binder or in the TMF Document or Final CRF Document type
Note: To enable auto-classification and metadata extraction functionality for documents in languages other than English, contact Veeva Services to enable the Multilingual Model feature.